
Where Do Your Food Dollars Go?
AUTHOR: Leslie Wander
Spending your food dollars to improve our community
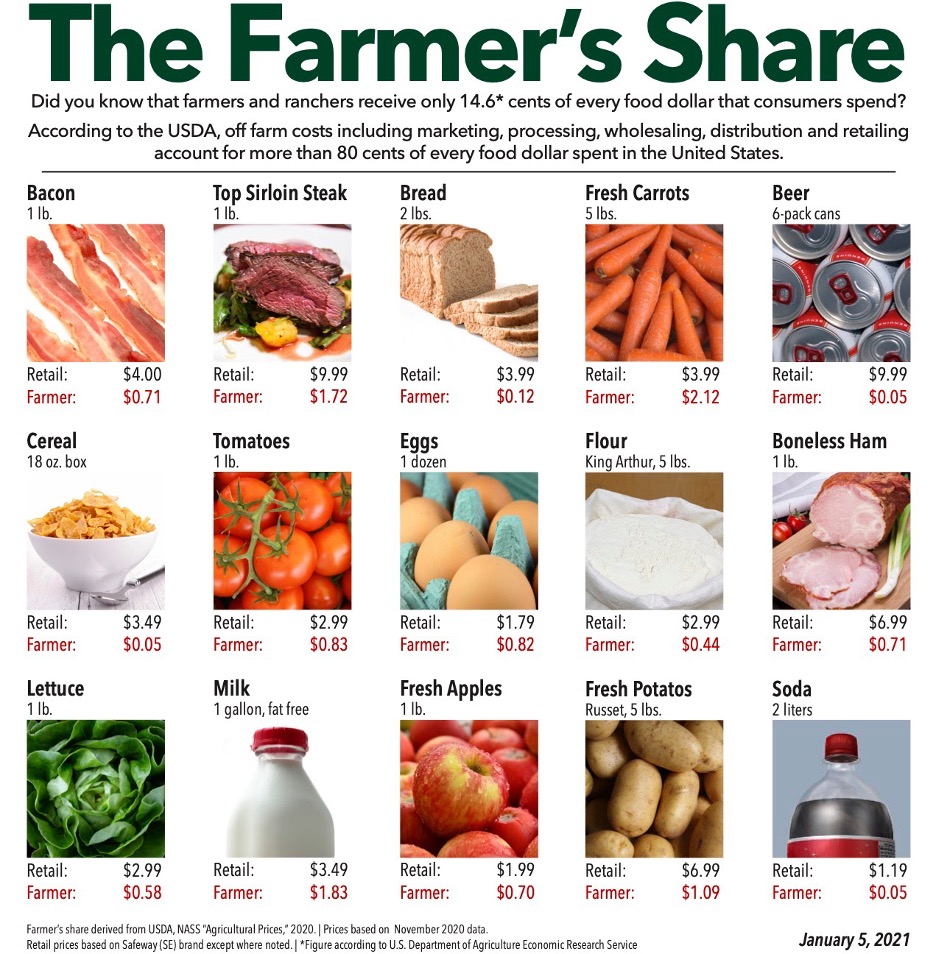
According to the National Farmers Union data from November 2020, USDA data across a wide range of food categories show that farmers receive roughly 1/7 of each dollar spent at retail. “According to the USDA, off farm marketing costs including marketing, processing, wholesaling, distribution, and retailing account for more than 80 cents of every food dollar spent in the United States.” The specific proportion that goes to farmers varies by food type. I will try to show how food costs get built into products, so that you can have a better idea of where and how to seek the best food value.
Adding value via processing
The foods shown in the chart can be broken down into categories based on how much processing is done to bring the food to market and where that processing occurs. The prices used in this chart are based on the food being purchased at traditional retail outlets.
Processed on the farm: products like eggs, carrots, tomatoes, lettuce, potatoes, apples fit into this category. They are harvested, cleaned, and prepared on the farm for market. On average, 1/3 (33%) of the retail price of these foods goes to the farmer.
Processed off-farm: products like bacon, steak, flour, milk fit into this category. They are harvested from the farm, transported to a processing facility which produces the finished product for market. On average, 1/4 (25%) of the retail price for these products goes to the farmer.
Processed into ingredients which are used in further processed foods: products like bread, beer, soda fall into this category. The farm product is harvested, transported to an ingredient processor. The ingredients are transported to the food manufacturer who prepares the product for market. On average, 1/40 (2.5%) of the retail price goes to the farmer.
Processed into “convenience foods”: products like frozen prepared dinners, baking mixes, etc. fall into this category. These return even less (<2.5%) to the farmer.
In general, as more “value” is added to the food product, a much smaller proportion of the retail price accrues to the farmer.
Adding value via purchase location
For the section above, we were referencing foods purchased at retail. You can purchase foods in a variety of ways, and this also affects the proportion of dollars that accrue to the farmer.
Directly from the farmer. All the purchase price in this case goes to the farmer.
Farmer’s market. Most of the purchase price goes to the farmer, less fees paid to the market for the right to sell there and costs associated with transport and display of product.
Food hubs or co-ops These may acquire products directly from farmers, but costs are added for transport, the retail building, and staff.
Retailers that purchase directly from manufacturers. Examples of this include Walmart, Aldi, Trader Joe’s, Costco, and grocer’s private label brands. Retail margins tend to be 33-50%.
Retailers that purchase products via wholesalers. Many grocery stores and co-ops purchase products in this manner. Wholesale margins tend to be 20-30%, in addition to the retailer margin described above.
Examples:
- Spending $4.00 directly with the farmer in your foodshed puts $4.00 into your local economy.
- Spending $4.00 at the farmer’s market puts $4.00 in your local economy, but slightly less than $4.00 goes to the farmer.
- Spending $4.00 at a retailer in group 4 puts somewhere between $1.20 – 2.00 into retail margins, leaving $2.00 – 2.80 for the farmer.
- Spending $4.00 at a retailer in group 5 takes additional funds to cover the wholesale margin, ranging from $0.40 -0.84, leaving somewhere between $1.50 -2.14 for the farmer.
So, your local economy benefits most when you can purchase as close to the farmer as possible.
Transparency of product labeling
When I can visit the farm, I can see exactly how the food is produced. I can ask questions about starting materials and farm practices. Otherwise, I’m dependent on the words of the marketing department associated with the food. The legally allowed descriptions do not make it easy for consumers to truly understand what they’re buying. There’s a lot of romance in the pictures and copy to entice us to buy at the highest price possible. For example, you can buy eggs that are eggs, cage-free eggs, cage-free organic eggs, free range eggs, pasture raised eggs, and more. It takes a lot of research to understand exactly what these terms mean.
Food miles and quality
The cost of food transportation is built into the cost breakdown described above. But consider two extremely different cases for eggs. In one case, I can purchase eggs produced in my foodshed, with the total distance traveled likely well under 100 miles. Or I can purchase free range eggs produced in New Hampshire, Pennsylvania, Indiana, or Iowa, depending on the brand I choose, which will travel between 300 – 1400 miles.
When you purchase foods locally, petroleum, pollution, and road wear costs for that food are obviously reduced when compared to traditionally sourced food. In addition, the food variety can be chosen for taste, nutrition and can be harvested at peak quality, rather than focusing on robustness to aging and damage during distribution. Also, because the distances are smaller, and the number of intermediate steps is fewer (transfers to manufacturer, wholesaler and retailer), the food is consumed much sooner after harvest. Reduced travel, reduced age, and variety choices all contribute significantly better taste and nutrition.
Your Food Budget as an opportunity to invest in your community
The average family in the US spends $4600 per year for foods consumed in the home. As I learn more about exactly where my food dollars are going, I’m beginning to make very conscious shifts to spend those dollars closer to home where I can. It’s taking some shifts in my behaviors, but as I make those shifts, I’m finding quality is improved, time is spent differently, and my local community benefits.